Once you have established the connection, the following window will be displayed (click on the image to enlarge it):
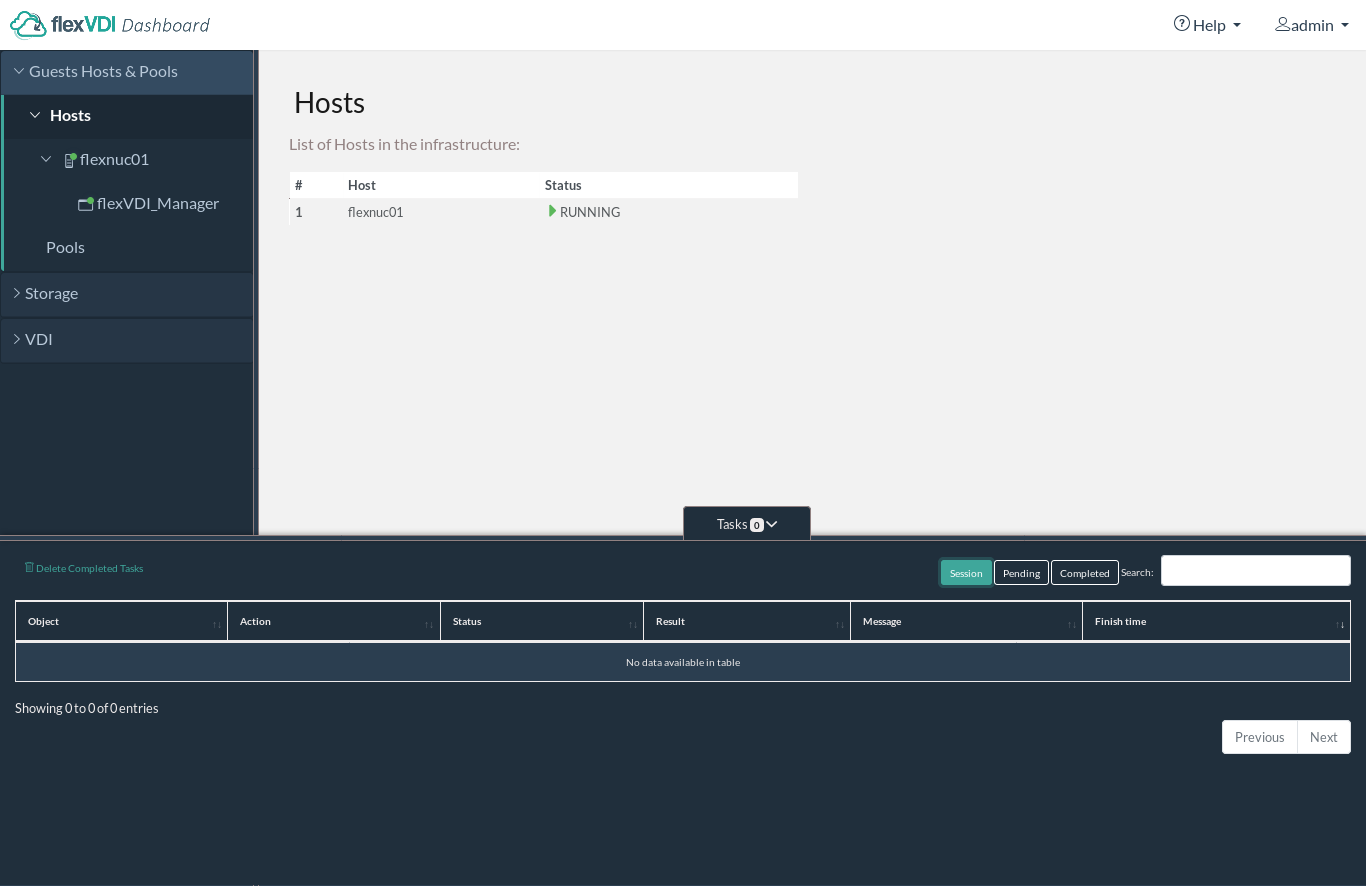
The flexVDI Dashboard window is divided in three main areas: the tree view to the left, the details view to the right, and the tasks view at the bottom.
...
"Guest/Host/Pool" is initially selected, as you can see in the image above. It contains two subtrees: Hosts and Pools. After a fresh install, you will see a list with one host and no pool:
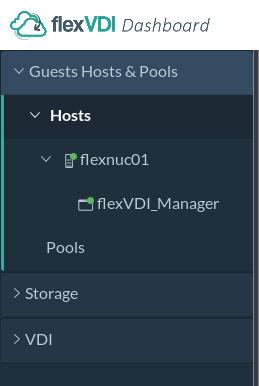
The The Host should have a green round icon, meaning that its status is "Running". If the Host is not active, or it cannot be contacted, its icon will show a red cross. Make sure the flexVDI Agent is running in the host and that the firewall accepts incoming connections. The tree also displays that the flexVDI Manager is running on that Host.
...