The main window
- Javier Celaya (Unlicensed)
Once you have established the connection, the following window will be displayed (click on the image to enlarge it):
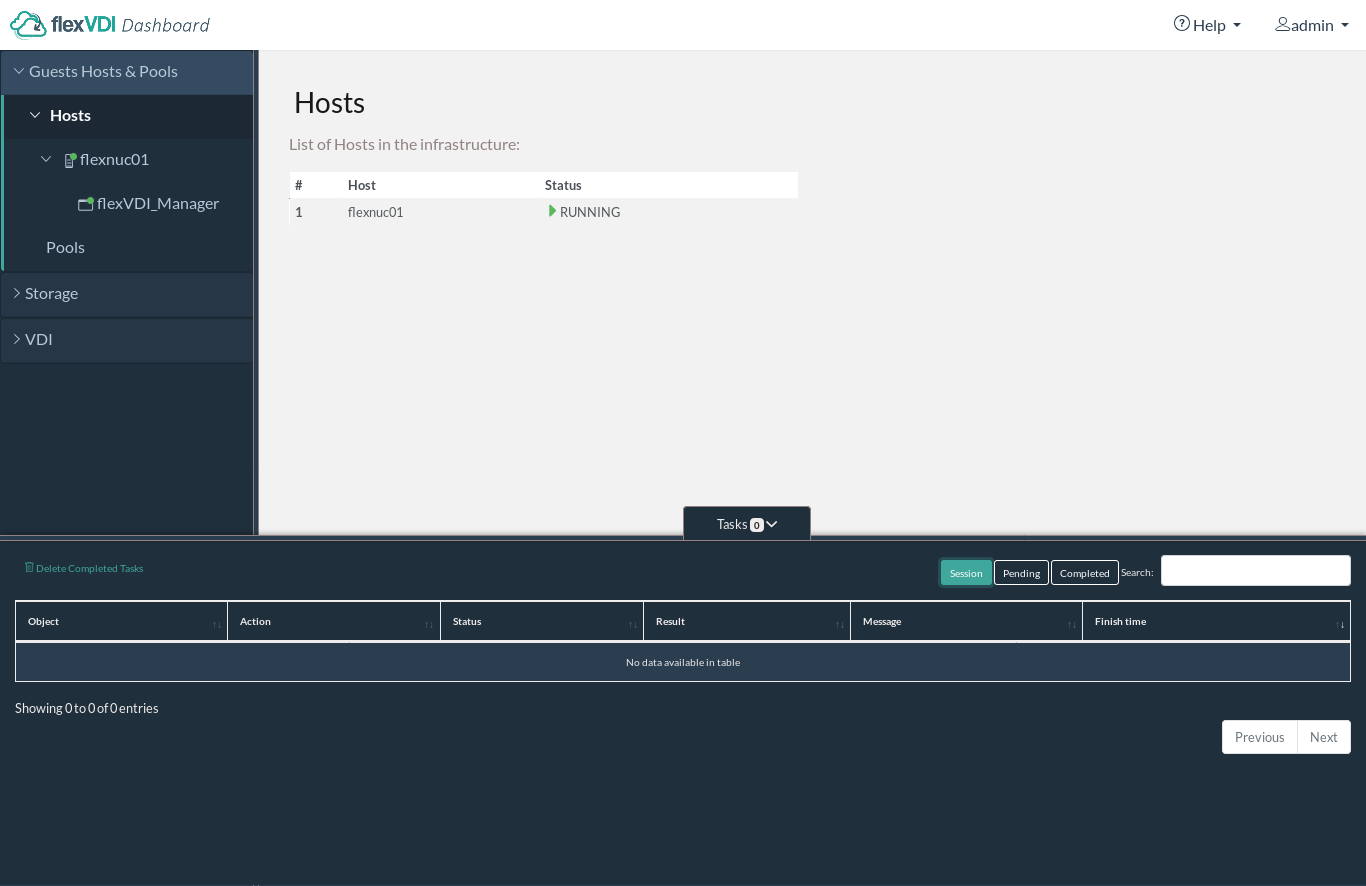
The flexVDI Dashboard window is divided in three main areas: the tree view to the left, the details view to the right, and the tasks view at the bottom.
The tree view
This area lists the objects of the platform, in a hierarchical way, and grouped in three sections:
- Guest/Host/Pool: As its name states, lists the guests, hosts and pools of the platform. The icon next to each object reflects its state: disabled, running, paused, ...
- Storage: This section contains the different storage objects.
- VDI: Finally, this section lists the Terminal and Desktop Policies, which describe how users are eventually mapped to their desktop.
"Guest/Host/Pool" is initially selected, as you can see in the image above. It contains two subtrees: Hosts and Pools. After a fresh install, you will see a list with one host and no pool:
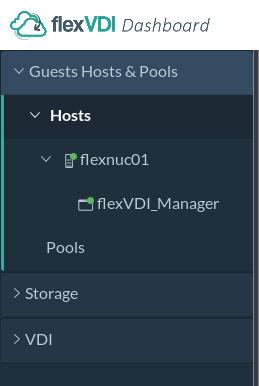
The Host should have a green round icon, meaning that its status is "Running". If the Host is not active, or it cannot be contacted, its icon will show a red cross. Make sure the flexVDI Agent is running in the host and that the firewall accepts incoming connections. The tree also displays that the flexVDI Manager is running on that Host.
The details view
This area shows detailed information about the different objects of the platform. It is usually divided into several tabs, that contain different views of the object at hand. We will see several examples during this guide.
The tasks view
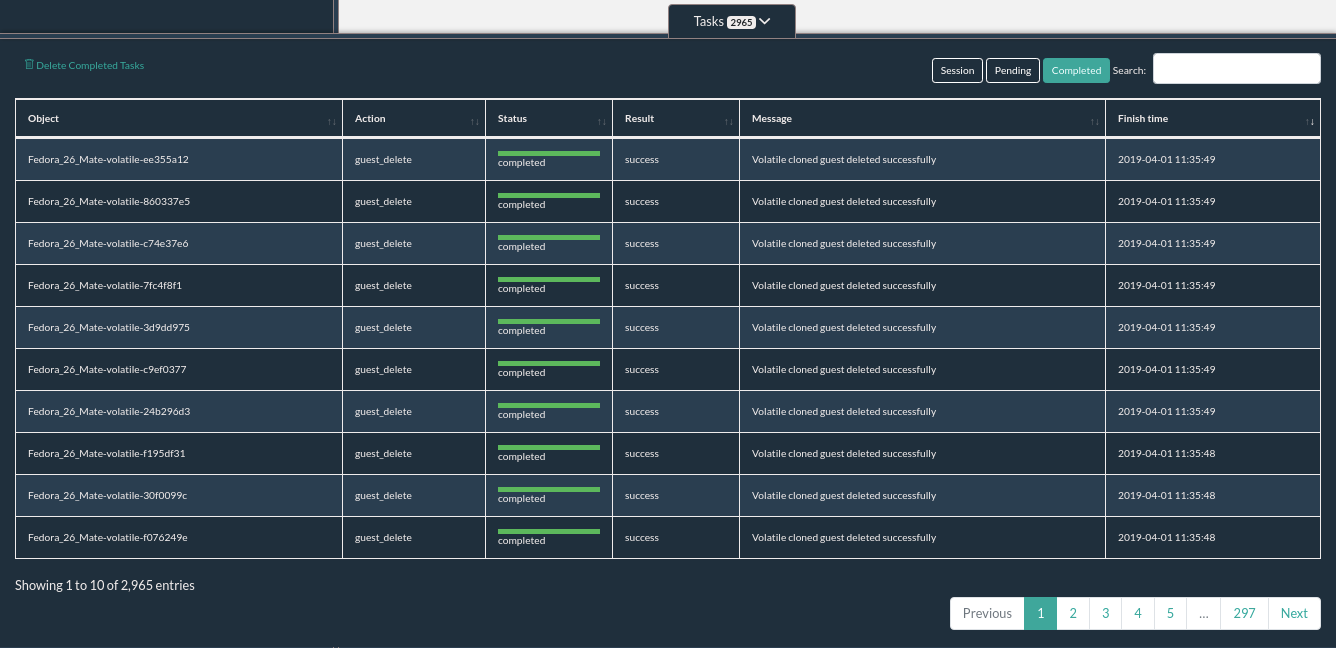
The lower area provides information about Tasks. A task is a detailed record of an action requested to flexVDI Dashboard, such as "Create a new Guest called Test". Tasks are organized in a table that can be sorted by any column. The list of tasks that is presented to the user can be filtered by keyword with the search input in the top-right corner and with the buttons next to it:
Session: It shows all the tasks, past and present, that have been created since the flexVDI Dashboard application was opened in the web browser.
Pending: It shows tasks started but not finished yet. Some actions, like copying a disk image, which usually involves copying a lot of information from/to disk, may take a while to complete, and will appear on this tab until they end.
Completed: It shows the history of all tasks that have been completed. This includes tasks initiated in previous sessions.
The table shows the following information for each task:
Object: Object of the platform targeted by the task.
Action: Action performed by the task (Run a guest, delete an image, ...)
State: Either running or finished.
Result: Success or error. Additionally, if a task results in an error, its background changes to red.
Result message: Any message returned by the task once finished. Most useful on error.
Time of execution: Time at which the task ended.
The task log can be cleared when no longer useful. To do so, click on the "Delete completed tasks" link to delete all completed tasks.