Once you have established the connection, the following window will be displayed:
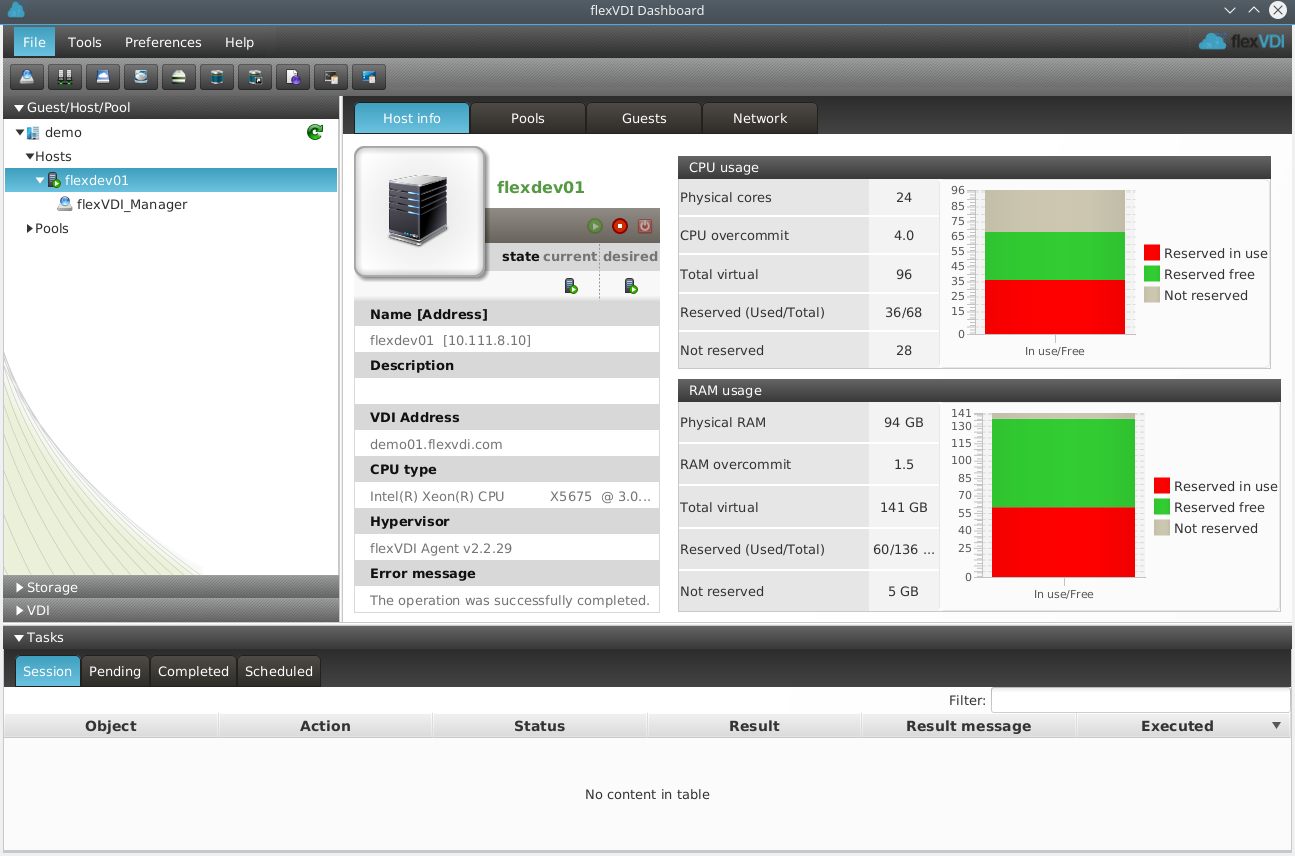
The flexVDI Dashboard window is divided in three main areas: left, right and bottom.
Left area: The tree view
This area lists the objects of the platform, in a hierarchical way, and grouped in three sections:
- Guest/Host/Pool: As it name states, lists the guests, hosts and pools of the platform. The icon next to each object reflects its state: disabled, running, paused, ...
- Storage: This section contains the different storage objects.
- VDI: Finally, this section lists the Terminal and Desktop Policies, which describe how users are eventually mapped to their desktop.
"Guest/Host/Pool" is initially selected, as you can see in the image above. The root of the tree is the name you entered when you configured the Manager connection parameters. If you unfold it, two elements are revealed: Hosts and Pools. After a fresh install, you will see a list with one host and no pool:
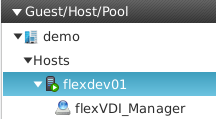
The Host should have a green round icon with a white arrow inside, meaning that its status is "Running". If the Host is not active, its icon will show a crossed out red circle. The tree also displays that the flexVDI Manager is running on that Host.
Right area: The details view
This area shows detailed information about the different objects of the platform. This area is usually divided into several tabs, that contain different views of the object at hand.
If you select the Host in the tree view, information about it is shown in the details view. This information is divided into four tabs:
Host info tab
This tab displays basic information about the Host, and a summary of its available resources.

The table on the left shows:
Current and desired state. If they differ, the Manager will try to bring the Host to the desired state.
Name, address and description.
VDI address: This is the IP address reported to the VDI clients to connect to. This is required when the Host has a public and a private address.
CPU type and Hypervisor version.
Message provided by the Host's agent in case of error.
The graphs on the right show a summary of the available resources in this Host. Hosts provide CPU and RAM resources to Guests. The total resources offered by a Host consist of its physical resources adjusted by an overcommit factor. By overcommiting, a Host can offer more resources than actually available. It is safe to overcommit CPU resources, since they are time-shared by the Guests. On the other hand, overcommiting RAM resources is not recommended at all; do it under your own responsibility.
Pools tab
This tab displays information about the Host resources assigned to each of the Pools.

A Pool is a set of CPU and RAM resources available to the Guests associated to it. A Pool's resources may come from different Hosts, and each Host may contribute resources to many Pools. The list on the left contains the Pools to which this Host is contributing resources, plus the set of resources not contributed to any Pool. When you select one of the items in the list, the charts on the right reflect how many resources are free and in use in that Pool.
Guests tab
This tab shows the Guests running on the selected Host and the amount of resources allocated by them.

Network tab
Finally, this tab shows the network interfaces available to the selected Host. They can be configured with the flexVDI Config tool.
- Physical interfaces.
- Bridge interfaces.
- Bonding interfaces.
- VLAN interfaces.
 Bottom area: The tasks view
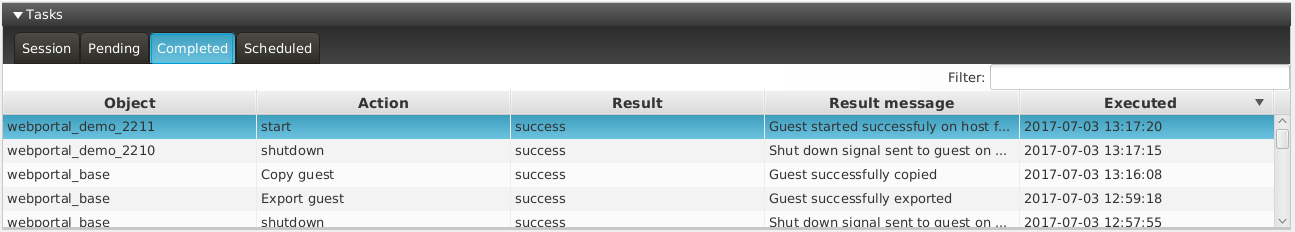
The lower area provides information about Tasks. It consists of four tabs:
- Session: It shows all the tasks, past and present, that have been created since the Dashboard connected to the Manager.
- Pending: It shows tasks started but not finished yet.
- Finished: It only shows finished tasks.
- Scheduled: Not implemented yet.
All of them contain a table with the following information for each task:
- Object: Object of the platform targeted by the task.
- Action: Action performed by the task (Run a guest, delete an image, ...)
- State: Either running or finished.
- Result: Success or error. Additionally, if a task results in an error, its background changes to red.
- Result message: Any message returned by the task once finished. Most useful on error.
- Time of execution
If you double-click on a task, it will open a dialog with its information. Use it when the result message is too long to be correctly displayed in the table.
Additionally, the task list can also be filtered with the input box in the upper right corner. Enter a word to filter by and hit return.